
Assignment #2
Quadratic Equation
by
Megan Dickerson
What happens to ![]() as 'a' is varied?
as 'a' is varied?
Look at this equation with several values of 'a' on the same graph.


All of these equations graphed share a commom point. That point is (0,2). When a=0, y=x+2 is a line with slope= 1 and y-intercept=2. The point (0,2) is where all 6 of the graphs pass through the y-axis. So, how does the change in 'a' effect my graph. I notice that when 'a' is larger (green) the parabola is skinnier. As 'a' becomes closer to zero(blue), the parabola widens out. Then, when 'a' is negative(black) the parabola is upside down. So, 'a' changes the shape of the parabola by making it skinnier or wider, and by making it open upwards or downwards.
Before I make my conclusions I want to look at another set of graphs all on the same coordinate plane with different values of b and c this time.


I used the same 6 values for 'a', but made b=-1 and c=-3.
This time all the graphs share the point (0,-3). When a=0, the graph of y=-x-3 is a line with slope=-1 and y-int=-3. Once again the skinniest graph(green) has the largest value of 'a', the widest graph (blue) has the value of 'a' closest to zero, and the graph where 'a' is negative has a parabola that opens downward.
My conlcusions
When a >0, in the equation ![]() the parabola opens upward.
the parabola opens upward.
When a<0, the parabola opens downward.
When a=0, the graph is not a parabola but a line.
In a parabola the axis of symmetry is x= -b/2a. So when b is fixed, as 'a' gets larger, the axis of symmetry gets closer to x=0, but when 'a' gets closer to zero, then the axis of symmetry moves farther away from x=0.
In the first case when b=1 and c=2, the axis of symmetry was x = -1/2a. As 'a' got closer to zero, (.5 for example), the axis of symmetry moved to the left away from x=0. When 'a' was positive the axis of symmetry was negative, and when a was negative the axis of symmetry was positive.
In the second case when b=-1 and c=-3, the axis of symmetry was x=1/2a. As 'a' got closer to zero, the axis of symmetry moved farther away from x=0 to the right.
The vertex of the parabols is directly related to the axis of symmetry. The x-value is the value found for the axis of symmetry and the y-value of the vertex is found by plugging x=-b/2a into the orginal equation.
So, as 'a' is greater, the vertex moves closer to the y-axis (x=0), and as 'a' is closer to zero, the vertex moves farther away from the y-axis.
Further Exploations
Now to further explore the equaion  I am going to examine 'b' and 'c'.
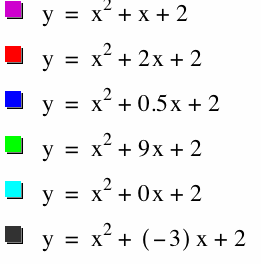
First lets keep 'a' and 'c' fixed, and look at the graph as 'b' is varied.


All 6 graphs have the common point (0,2). They all have around the same width, but the vertex changes. The graphs of b=1,.5,0 are all very similar. When b=0, it is the standard graph of a parabola moved up 2 on the y-axis. The graph that really stands out is the green one (b=9). The axis of symmetry on this graph is x=-9/2, so the vertex is (-4.5, -18.25). The black graph (b=-3) is on the other side of the y-axis, since the axis of symmetry is x=3/2.
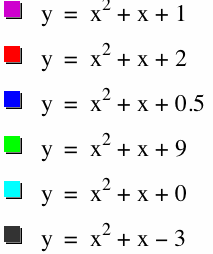
Now, keep 'a' and 'b' fixed and look at the graph when 'c' is varied.


These graphs do not have a common point. They touch the y-axis at c. All 6 graph have the same axis of symmetry since x=-1/2 for all graphs. The x-value of the vertex is the same for each graph, but the y-value changes.